
Blog
Warehouse Perimeter With AI Towers: The Architecture That Pays Back
A four-point installation pattern for distribution warehouses. We show where the cameras go, why, and how the line-of-sight math drives the count.

Dr. Raphael Nagel
December 24, 2025
A distribution warehouse perimeter is not a fence. It is a viewshed, and viewsheds are calculated, not assumed.
The industry has spent twenty years confusing the two. Fences mark property. Viewsheds determine whether an intruder is detected at the loading apron or at the dock door, and the cost difference between those two outcomes is measured in pallets, not in pixels. A modern AI tower deployment around a distribution facility is therefore not a question of how many cameras the operator can afford. It is a question of how the geometry of the site, the height of the racking outside, the angle of the truck staging area and the placement of trailer parking dictate where the towers must stand. Get the math right and four towers cover a site that previously required twelve poles, ten guards and a perimeter loop that nobody actually walked. Get the math wrong and the operator buys an expensive monitoring system that watches the wrong rectangle.
What follows is the architectural pattern used by Boswau + Knauer on distribution facilities in the fifty thousand to one hundred fifty thousand square metre range. It is the pattern referenced in the book BOSWAU + KNAUER. From Building to Security Technology, refined across deployments in central European logistics corridors. The pattern is not proprietary. The discipline of applying it is.
The four-point pattern as a starting axiom
A rectangular distribution warehouse, oriented with its long axis east to west and its dock doors along one of the long sides, can be covered with four AI towers placed at the corners of an outer rectangle that sits roughly twenty to thirty metres beyond the property line of the building itself. This is the starting axiom. It is not a universal solution, but it is the configuration from which deviations are justified.
The logic is geometric. Each tower carries a sensor head at a height between six and nine metres, depending on the model and the local approval regime. From that height, a wide-angle thermal sensor combined with a high-resolution daylight camera reaches roughly one hundred fifty metres of reliable classification range under typical European weather conditions. Detection range, in the raw sense of pixels on target, extends further, but classification range is the figure that matters, because an unclassified blob does not justify a response. Four towers at the corners of a two hundred by one hundred metre rectangle therefore produce overlapping classification fans that cover the entire perimeter, with redundancy at every midpoint. If one tower fails or is obscured by a parked trailer, the adjacent tower still covers the gap.
The four-point pattern also matches operational reality. Distribution warehouses have predictable corner conditions. The corners are where fences turn, where lighting masts already stand, where utility runs terminate and where access roads bend. Placing AI towers at corners therefore aligns with existing infrastructure rather than fighting it. Power is available, civil works are minimal, and the towers do not interfere with truck swing radius or fire department access lanes. The operator who tries to place towers at the midpoints of the long sides almost always discovers, after the first week of operations, that the chosen position blocks a sightline that some warehouse manager considered sacred. Corners are uncontested.
The pattern fails on three site types. It fails on L-shaped buildings, where one of the four corners looks at a wall rather than at open ground. It fails on sites with internal yards enclosed by other tenants, where the viewshed is interrupted by third-party structures. And it fails on sites with significant grade change, where a tower at the low corner cannot see across the high corner because the slope itself blocks the line. In all three cases the answer is not to abandon the pattern but to add a fifth tower, placed where the geometry demands it. The discipline is to add deliberately, not reflexively.
Line-of-sight math, in numbers operators can defend
The line-of-sight calculation that drives tower count is straightforward, but it is rarely written down in a form that survives procurement review. Three variables matter. The first is the height of the sensor above the highest expected obstruction in its field of view. The second is the maximum range at which the chosen sensor can classify a human target with the confidence threshold demanded by the response protocol. The third is the horizontal field of view of the sensor at that range.
For a typical AI tower configured with a thermal sensor at seven metres of height, the obstruction calculation begins with parked trailers. A European semi-trailer reaches roughly four metres in height. A tower at seven metres therefore clears the trailer roof by three metres, which is sufficient to see a standing person at one hundred metres beyond the trailer. If the operator stacks containers on the apron, the effective sensor height shrinks by the height of the stack, and the classification range collapses accordingly. The math is unforgiving here. A two-high container stack at the dock apron removes more than half of the useful viewshed of a perimeter tower placed behind it.
Classification range itself is a function of pixels on target. Most operator response protocols, aligned with the guidance in IEC 62443 zones and conduits thinking and with the detection categories described in NIST CSF 2.0 for physical-cyber convergence, require at least twenty to thirty vertical pixels on a standing human target before a classification is considered actionable. A modern eight megapixel sensor with a moderate telephoto lens delivers that pixel count at approximately one hundred twenty to one hundred eighty metres, depending on lens choice. Thermal sensors classify at lower pixel counts because the heat signature itself contributes to the recognition, and reliable thermal classification of a human extends to roughly two hundred metres under clear conditions.
The horizontal field of view at maximum classification range determines how much perimeter a single tower covers. A sensor with a sixty degree horizontal field of view at one hundred fifty metres covers a fan roughly one hundred seventy metres wide at its outer edge. Four such fans, placed at the corners of a rectangle and oriented diagonally inward, produce overlapping coverage with redundancy at the midpoints of each side. The operator can verify this geometry on a CAD drawing in under an hour. The exercise is mandatory. Boswau + Knauer does not deploy a tower without a documented sightline study, because a tower placed on intuition produces alarms that are not defensible to the insurer.
How loading zones distort the pattern
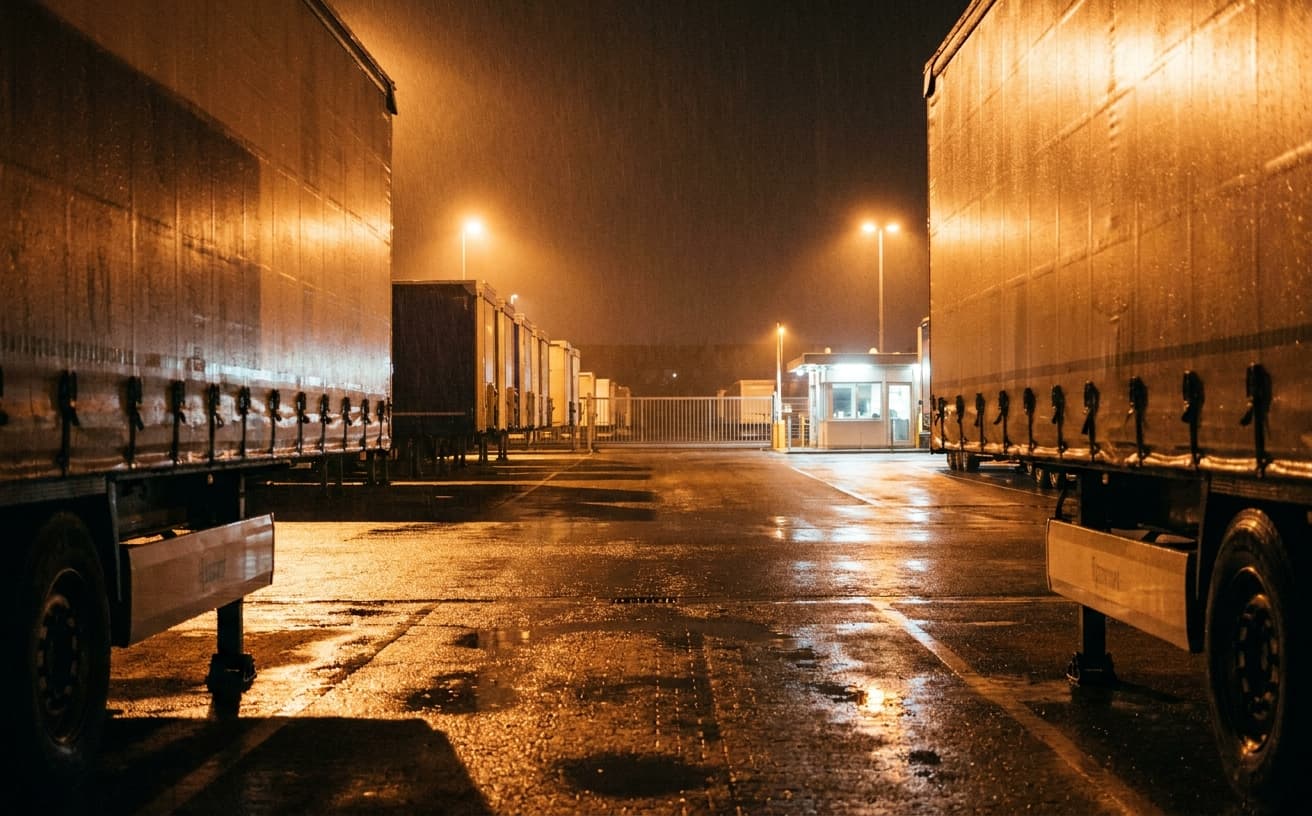
Loading zones are where the four-point pattern collides with operational reality. A distribution warehouse moves trailers continuously. The dock apron is occupied by stationary trailers for hours at a time, by maneuvering tractors at all hours, and by yard tractors that move trailers between the dock and the staging area. Each of these vehicles occupies space that the camera would otherwise see across.
The first distortion is the trailer wall. When the dock is fully occupied, the apron looks, from outside, like a continuous wall of trailer sides three to four metres high. A perimeter tower aimed across this wall sees the wall, not what lies behind it. The operational consequence is that the apron itself becomes an internal zone that must be covered from the inside, not from the outer perimeter. This is where many deployments fail. The operator installs four perimeter towers, declares the site covered, and discovers six months later that every documented theft happened in the gap between trailers, invisible to the perimeter because the trailers themselves blocked the view.
The fix is structural. A distribution warehouse with active dock operations requires a hybrid configuration. The outer four-point perimeter handles approach detection, classifying any human or vehicle crossing the fence line. An additional set of dock-facing sensors, mounted on the building itself at a height that clears the trailer roof, handles the apron. These dock sensors are not perimeter devices in the traditional sense. They watch the gaps between trailers, the under-trailer space, and the pedestrian routes between the dock office and the trailer cabs. Their analytics are tuned differently. The perimeter tower asks whether a human crossed a virtual fence. The dock sensor asks whether a human is in a space where, at this hour and under this schedule, no human should be.
The second distortion is the staging yard. Many distribution facilities operate a trailer staging area where empty or loaded trailers wait for a tractor. This area can hold thirty to one hundred trailers in dense parking. From a perimeter tower, the staging yard is a forest. No single tower can see into it. The pattern here is to elevate. A staging yard demands either a higher tower, twelve to fifteen metres, placed at a corner of the yard itself, or a dedicated mid-yard pole that looks down into the rows. The choice depends on local approval. Where height is restricted by zoning, the answer is to deploy a slightly denser configuration of standard-height towers with overlapping ground-level coverage of the aisles between trailers.
Detection latency and the response loop
A tower that detects does not protect. A tower that detects and triggers a documented, timed response protects. The distance between those two states is measured in latency, and latency is where most deployments quietly degrade over the first year of operation.
Detection latency in a modern AI tower has three components. The first is sensor-to-edge latency, the time between a pixel changing and the on-device analytics producing a classification. On current hardware this is well under one hundred milliseconds. The second is edge-to-operator latency, the time between the analytics result and a human operator seeing the alarm on a workstation. This depends on the network architecture. A local monitoring station on site sees the alarm in under a second. A remote monitoring centre, connected over a managed link, typically sees it within one to three seconds. The third component is operator-to-response latency, the time between the operator seeing the alarm and dispatching a verifiable response, whether that is a recorded voice challenge, a guard dispatch or a police call.
Operator-to-response latency dominates. Sensor latency is solved. Network latency is solved. Human latency is not. A well-trained operator at a properly staffed monitoring centre processes a confirmed intrusion alarm in twenty to forty seconds. An overloaded operator, or one who has been desensitised by false alarms, takes minutes. This is why false alarm reduction is not a technical nicety but the central determinant of whether the system works in practice. ASIS International guidance, NICB observations on warehouse loss patterns and GDV data on commercial property claims converge on the same point. The systems that produce measurable reductions in loss are the ones that produce few enough alarms to be taken seriously when they do.
Realistic, defensible end-to-end latency for a four-tower distribution warehouse deployment, from intruder crossing the perimeter line to documented response action, runs in the range of forty to ninety seconds. This is the figure that matters when the operator presents the system to the insurer. Anything faster requires either on-site armed response, which is not the norm in central Europe, or fully automated deterrence such as voice challenge and lighting, which most operators deploy as a first-stage response while the human verification runs in parallel.
What the architecture pays back
The four-point pattern, properly executed, replaces a perimeter guard model that runs roughly two hundred fifty thousand to four hundred thousand euros per year for a single shift of two guards on a medium distribution site. The capital cost of four AI towers, dock-facing sensors, the analytics platform and the integration into the existing monitoring contract sits in the range of one hundred eighty thousand to three hundred thousand euros depending on configuration, with annual operating costs for monitoring, maintenance and software in the range of forty to seventy thousand. The payback period, calculated against the guard cost alone, runs between twelve and twenty months.
This calculation excludes the second-order benefits, which are the ones that matter to the operations director rather than the finance director. A documented perimeter system with verified classification and timed response affects insurance premium negotiations under the ISO 27001 control families that physical security insurers now reference, and it affects the conversation with corporate customers whose own supply chain audits require evidence of perimeter integrity. BSI guidance on critical infrastructure and the NIST 800-53 PE control family, while written for different contexts, have become reference frameworks that procurement teams now cite when evaluating logistics partners. An operator who can produce a documented perimeter architecture, with sightline studies, latency measurements and false alarm rates, occupies a different position in those conversations than an operator who can produce a guard roster.
The architecture also scales. A second warehouse in the same region adds incremental cost roughly half that of the first, because the monitoring infrastructure, the analytics platform and the operational protocols are already in place. A third site adds even less. This is the difference between a security model that prices linearly with the number of sites and a security model that prices logarithmically. Over a five-site portfolio the difference becomes the deciding factor in whether security is a fixed cost that grows with the business or a fixed cost that the business outgrows.
What holds
The four-point pattern is a starting position, not a conclusion. It works on roughly seventy percent of European distribution warehouses without modification. The remaining thirty percent require additions, and those additions are dictated by geometry that any operator can verify on a CAD drawing in an afternoon. The discipline is not in knowing the pattern. The discipline is in measuring the site against it, identifying where the geometry breaks, and adding deliberately rather than reflexively.
What pays back is not the towers. It is the architecture that the towers enable. A documented sightline study, a measured latency budget, a tuned analytics configuration and an integrated response protocol together produce a system that an insurer can underwrite, a customer can audit and a finance director can defend. The hardware is the visible part. The architecture is the part that holds.
Operators who want to verify whether their site fits the pattern, and what the deviations would cost, can begin with the three-to-five day audit format described as Path II in the book. The audit produces a documented sightline study, a tower count with justification, a latency estimate and a wirtschaftlichkeit calculation in three scenarios. The operator who emerges from that audit knows what the deployment would cost, what it would save and where the geometry would force exceptions. Whether the deployment then proceeds with Boswau + Knauer or with another integrator is a separate question. The architecture, once documented, holds either way.
Frequently asked questions
How are AI towers placed around a warehouse perimeter?
The starting pattern is four towers at the corners of an outer rectangle sitting twenty to thirty metres beyond the building footprint, each at a height of six to nine metres, oriented diagonally inward to produce overlapping classification fans along every side. This pattern covers roughly seventy percent of European distribution warehouses without modification. The remaining thirty percent, principally L-shaped buildings, sites with internal yards or sites with significant grade change, require a fifth tower placed where the geometry demands. Tower placement is verified with a documented sightline study on a CAD drawing before any hardware is ordered.
What is the typical line-of-sight calculation?
Three variables drive the calculation. Sensor height above the highest expected obstruction, classification range of the chosen sensor and horizontal field of view at that range. A thermal sensor at seven metres clears a four metre trailer by three metres and classifies a standing human at roughly two hundred metres. A daylight sensor at the same height classifies at one hundred twenty to one hundred eighty metres depending on lens. A sixty degree horizontal field of view at one hundred fifty metres covers a fan roughly one hundred seventy metres wide at its outer edge. Four such fans, placed at corners, overlap at every midpoint.
How does setup interact with loading zones?
Loading zones break the perimeter pattern because parked trailers form a continuous wall three to four metres high that blocks the outer towers from seeing the apron. The fix is hybrid. The four-point perimeter handles approach detection at the fence line. Dock-facing sensors, mounted on the building itself above trailer-roof height, handle the apron and the gaps between trailers. Staging yards holding thirty to one hundred trailers require either elevated towers at twelve to fifteen metres or dedicated mid-yard poles, because no perimeter tower can see into a dense trailer forest from the outside.
What detection latency is realistic?
End-to-end latency, from intruder crossing the perimeter line to documented response action, runs in the range of forty to ninety seconds on a properly tuned four-tower deployment. Sensor-to-edge latency sits under one hundred milliseconds. Edge-to-operator latency runs one to three seconds depending on whether monitoring is local or remote. Operator-to-response latency, which dominates, runs twenty to forty seconds for a well-trained operator on a system that produces few enough false alarms to be taken seriously. False alarm reduction, not raw sensor speed, is the central determinant of whether the architecture performs in practice.
About the author
Dr. Raphael Nagel (LL.M.) is founding partner of Tactical Management. He acquires and restructures industrial businesses in demanding market environments and writes on capital, geopolitics, and technological transformation. raphaelnagel.com
More reading
Since 1892.
The firm is reached at boswau-knauer.de or +49 711 806 53 427.